


Power BI Consulting: Solving the Dashboard Sprawl Problem in Large Organizations
Picture the quarterly business review at a large enterprise. Finance presents one revenue figure, sales presents another, and operations brings a third from a dashboard built by an analyst who left two years ago. The first half hour goes to reconciling numbers instead of making decisions.
This is dashboard sprawl, and it has become one of the most stubborn problems in enterprise business intelligence. Power BI made analytics accessible to almost everyone, which is exactly why it spread so quickly across large organizations. Without structure, though, that accessibility produces thousands of reports, overlapping workspaces, and competing versions of the same metric.
Solving it rarely requires another tool. It requires a better operating model for the platform you already own, and that is where Power BI consulting earns its value. The right partner helps enterprises consolidate what they have built, govern what they build next, and turn a cluttered reporting landscape into a BI environment leaders trust.
What Is Dashboard Sprawl, and Why Does It Happen?
Dashboard sprawl is the unchecked growth of reports, dashboards, and semantic models across an organization, many of them duplicated, overlapping, or abandoned. Each one usually made sense to the person who built it. Together, they form a reporting estate that no one can fully map, maintain, or trust.
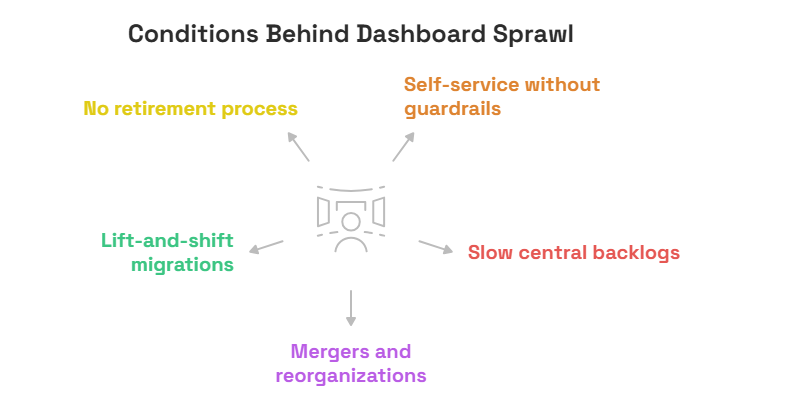
In large enterprises, sprawl tends to grow from the same few conditions:
- Self-service without guardrails: Power BI Desktop is free, and a licensed analyst can turn a spreadsheet export into a published report in an afternoon. Multiply that across thousands of employees, and duplication becomes inevitable.
- Slow central backlogs: When the BI team needs weeks to fulfill a request, business units build their own versions, often recreating logic that already exists elsewhere.
- Mergers and reorganizations: Acquired companies and restructured divisions arrive with their own reports, metrics, and reporting habits.
- Lift-and-shift migrations: Migrations from legacy tools such as SSRS often copy every old report into Power BI without asking which ones still matter.
- No retirement process: Reports are created constantly and rarely decommissioned. When an owner leaves, the dashboard stays behind, still refreshing and still consuming capacity.
None of these causes reflects bad intent. They reflect a platform that scaled faster than the governance around it.
The Real Business Cost of Dashboard Sprawl
Sprawl is often dismissed as a housekeeping issue. In practice, its consequences reach the boardroom.
Fragmented Data and Inconsistent KPIs
When every team builds its own semantic model, every team also writes its own business logic. “Active customer” might mean a purchase within 30 days in one report and 90 days in another. On-time delivery might be measured against the promised date in sales and the ship date in operations. Leaders end up debating definitions instead of performance.
Reporting Inefficiency
Analysts spend valuable hours reconciling figures and fielding the same question: which number is right? Meanwhile, duplicate semantic models refresh the same source data on separate schedules, competing for capacity and slowing the reports that matter most.
Slower, Riskier Decisions
When trust erodes, people hedge. Executives ask for manual validation before acting, or quietly return to spreadsheets. Sprawl also stalls AI-driven analytics and decision intelligence, because an AI assistant drawing on conflicting semantic models inherits the confusion and delivers it faster.
Rising Maintenance Costs and Compliance Exposure
Every redundant report has to be supported, secured, and updated whenever a source system changes. Unmanaged workspaces add risk too, since sensitive data can surface in reports shared far beyond their intended audience.
Not sure how far sprawl has spread?
Start with visibility. A structured assessment of your Power BI environment, covering report inventory, usage patterns, semantic model overlap, and governance gaps, shows where sprawl is costing you most. App Maisters BI and data analytics consultants can help you run one and prioritize what to fix first.


How Power BI Consulting Solves Dashboard Sprawl
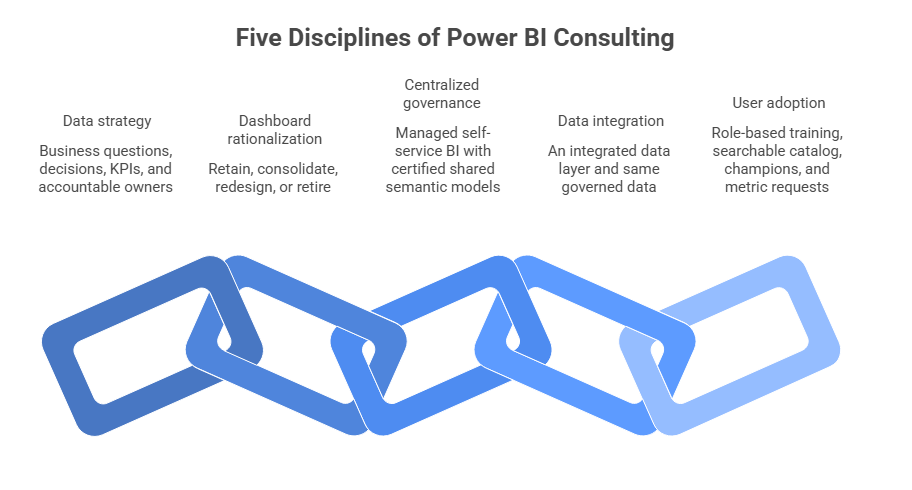
Effective Power BI consulting is not about building more dashboards. It is about building fewer, better ones on a foundation designed to scale, and that work spans five disciplines.
Data Strategy Before Dashboards
Consolidation starts with business questions, not visuals. Consultants work with stakeholders to define the decisions each function must make, the KPIs that inform them, and one accountable owner for every metric definition. For a Fortune 500 medical device manufacturer operating in more than 80 countries, App Maisters began with a business requirements document and an analysis of disconnected source systems. The result was five high-level Power BI views for leadership, each backed by two or three supporting visuals.
Dashboard Rationalization and Consolidation
Next comes an honest inventory. Using Power BI’s activity logs, usage metrics, and lineage view, consultants catalog every workspace, report, and semantic model, then sort each asset into four groups: retain, consolidate, redesign, or retire. Large estates usually contain a meaningful share of duplicate or rarely opened reports, so rationalization is often the fastest route to visible results.
Centralized Power BI Governance That Preserves Self-Service
Governance fails when it simply locks users out. The more durable model is managed self-service BI: a central team owns certified, shared semantic models, while business users remain free to build reports on top of them. Workspace standards, content endorsement, deployment pipelines, row-level security, and sensitivity labels give IT control without slowing the business down.
Data Integration Into a Single Source of Truth
Sprawl usually traces back to fragmented sources such as ERP exports, CRM extracts, and departmental spreadsheets. Consultants design an integrated data layer, whether a cloud data warehouse, a Microsoft Fabric lakehouse, or well-modeled dataflows, so every report draws from the same governed data.
User Adoption and Enablement
A consolidated environment succeeds only if people use it. That means role-based training, a searchable catalog of certified content, champions inside each business unit, and a simple way to request new metrics, so building another one-off dashboard stops being the easiest option.
Turn consolidation into lasting results
App Maisters Power BI consulting services bring these disciplines together, combining data strategy, data engineering, and hands-on Power BI development with governance built in from day one. As an ISO 27001-certified company, App Maisters treats security and access control as part of the design, not an afterthought.
From Scattered Dashboards to a Unified Power BI Ecosystem
Enterprises rarely fix sprawl in a single project. Those that succeed treat it as a phased transformation, and a well-run Power BI consulting engagement typically follows five stages:
- Assess: Inventory workspaces, reports, and semantic models, then map usage, ownership, and data lineage.
- Define: Agree on enterprise KPI definitions, data ownership, and a governance model that fits your culture.
- Consolidate: Build certified semantic models for core business domains, move high-value reports onto them, and retire the rest.
- Govern: Put workspace standards, deployment pipelines, and access controls in place so new content follows the rules by default.
- Scale: Extend certified content domain by domain, track adoption, and refine based on how people actually use the platform.
Turning Dashboard Sprawl Into Decision Clarity
Dashboard sprawl is a symptom of success, proof that people across the organization want data. The goal is not to suppress that demand but to channel it into an environment built on shared definitions, governed data, and content people trust. Organizations that get there spend less time arguing about numbers and more time acting on them.
Getting there takes more than a one-time cleanup. It takes a clear data strategy, honest rationalization, governance that protects self-service, and an integrated data foundation ready for AI-driven analytics. It also takes a partner who understands both the technology and the decisions it supports.
App Maisters brings Power BI consulting, data engineering, and BI governance together under one roof. Its consultants have helped a Fortune 500 medical device manufacturer and a healthcare software provider turn fragmented reporting into decision-ready insight.
Ready to streamline your BI ecosystem?
If your teams spend more time reconciling reports than using them, connect with App Maisters Power BI consulting team. App Maisters will assess your environment, pinpoint where sprawl costs you most, and build a practical roadmap to a unified, scalable Power BI platform.
FAQs
What does a Power BI consultant do?
A Power BI consultant designs, builds, and governs an organization’s Power BI environment. The work typically spans data modeling, DAX measures, Power Query transformations, report and dashboard development, workspace security, performance tuning, and user training. In large enterprises, the role increasingly centers on governance and consolidation, so every team works from the same certified semantic models. App Maisters Power BI consultants cover that full lifecycle, from data strategy and integration through deployment, training, and ongoing optimization.
What is dashboard sprawl, and what causes it?
Dashboard sprawl is the uncontrolled growth of duplicate, overlapping, and abandoned reports, dashboards, and semantic models across an organization. It typically stems from self-service BI without guardrails, slow central BI backlogs, mergers, lift-and-shift migrations from legacy reporting tools, and no process for retiring old content. The result is conflicting KPIs, wasted capacity, and declining trust in data. App Maisters helps enterprises trace sprawl to these root causes before deciding what to consolidate, redesign, or retire.
How do you reduce dashboard sprawl in Power BI?
Start with an inventory. Power BI’s usage metrics, activity logs, and lineage view reveal which reports people actually open and which semantic models feed them. From there, retire unused content, move duplicates onto shared, certified semantic models, and redesign the reports that remain. Workspace standards, an endorsement process, and a clear intake path for new requests keep sprawl from returning. App Maisters runs this dashboard rationalization as a phased engagement, so the gains from cleanup last.
What are the best practices for Power BI governance?
Strong Power BI governance balances control with self-service. Proven practices include organizing workspaces by business domain, certifying shared semantic models, separating development, test, and production with deployment pipelines, enforcing row-level security and Microsoft Purview sensitivity labels, naming data owners and stewards, and monitoring usage to retire stale content. Many enterprises formalize these rules through a BI center of excellence. App Maisters builds Power BI governance frameworks on this managed self-service model, so business users stay agile while IT stays in control.
How much does Power BI consulting cost?
There is no flat price, because cost follows scope. The biggest drivers are the size of the existing report estate, the number and complexity of data sources, current governance maturity, security and compliance requirements, Fabric licensing and capacity decisions, and the level of training and adoption support required. A focused assessment costs far less than an enterprise-wide consolidation program. App Maisters can begin with an assessment of your Power BI environment, turning an open-ended question into a scoped, phased estimate.
Is Power BI being replaced by Microsoft Fabric?
No. Power BI is one of the core experiences inside Microsoft Fabric, Microsoft’s unified analytics platform, and existing reports keep working. The most visible change is licensing for large deployments, where Microsoft has been retiring Power BI Premium capacity in favor of Fabric capacity. For organizations tackling sprawl, Fabric adds OneLake for shared storage, lakehouses and warehouses for integration, and the OneLake catalog for finding governed content. App Maisters helps teams decide which Fabric capabilities they actually need before investing.
How do I choose the right Power BI consulting company?
Look beyond dashboard design. The right Power BI consulting company should bring data strategy, data engineering, and governance expertise, share case studies from organizations of similar size, follow recognized quality and security standards, and plan for user adoption and knowledge transfer. App Maisters, a Houston-based company with ISO 9001 and ISO 27001 certifications, combines these capabilities with proven BI delivery in healthcare and manufacturing.