Business Intelligence Solutions: Strategy, Tools & Implementation
Picture this: your sales team is celebrating a record quarter, but your operations team is quietly drowning in a backlog that will erode next quarter’s margins. Finance sees a different number than marketing. The CEO asks for a real-time dashboard and the answer is “we’ll have it by Thursday.” Meanwhile, your competitor just pivoted their entire product strategy based on a live customer signal three weeks ago.
This is the data gap and it’s still the most expensive silent tax on business performance in 2026. Companies aren’t failing because they lack data. They’re failing because they can’t turn that data into decisions fast enough. That’s exactly what Business Intelligence (BI) solutions are built to fix. Modern BI combines real-time data pipelines, AI-generated insights, self-service analytics, and governed data ecosystems giving every layer of your organization the clarity to act with confidence.
Key insight: According to industry research, organizations with mature BI capabilities make decisions up to 5x faster than peers and report 20–30% improvements in operational efficiency within 18 months of implementation.
What Are Business Intelligence Solutions?
Business Intelligence refers to the technologies, processes, and practices that collect, integrate, analyze, and present business data enabling smarter, faster, and more confident decision-making across an organization.
At its core, a BI solution answers one fundamental question: What is actually happening in my business, and what should I do about it?
Core Components of a Modern BI System
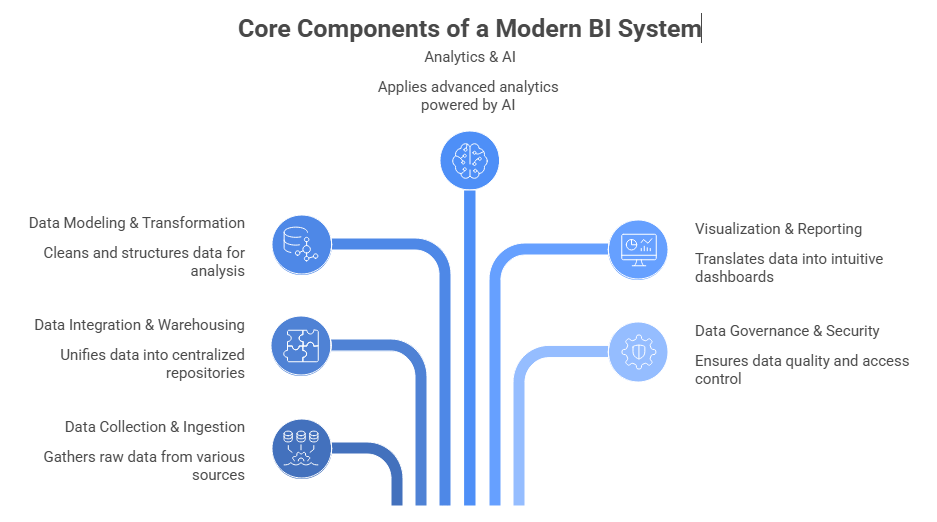
- Data Collection & Ingestion: Gathering raw data from ERP systems, CRMs, cloud apps, social platforms, IoT devices, and more.
- Data Integration & Warehousing: Unifying disparate data sources into centralized repositories (data warehouses, data lakes, or lakehouses) for consistent analysis.
- Data Modeling & Transformation: Cleaning, structuring, and enriching data so it’s analysis-ready and trustworthy.
- Analytics & AI: Applying descriptive, diagnostic, predictive, and prescriptive analytics increasingly powered by AI and machine learning.
- Visualization & Reporting: Translating complex data into intuitive dashboards, charts, and narratives that non-technical users can act on.
- Data Governance & Security: Ensuring data quality, access control, compliance, and lineage across the entire ecosystem.
Traditional BI vs. Modern BI: What's Changed?
Dimensions | Traditional BI | Modern BI () |
Data latency | Batch processing; weekly/monthly reports | Real-time & near-real-time streaming |
Users | IT & analyst-dependent | Self-service; any business user |
Insight type | Descriptive (“what happened”) | Predictive & prescriptive (“what will happen & what to do”) |
Infrastructure | On-premise, rigid | Cloud-native, elastic, hybrid |
AI/ML | Absent or bolt-on | Embedded throughout the analytics layer |
Governance | Manual, siloed | Automated, centralized, lineage-tracked |
Why Businesses Need BI in 2026
The business environment in 2026 is defined by volatility, hyper-competition, and an explosion of data touchpoints. The organizations that thrive are those that treat data as a strategic asset not an IT problem.
- 328M terabytes of data created globally every day in 2026
- 73% of enterprise data goes unanalyzed a massive missed opportunity
- $37B+ global BI market size projected in 2026, growing at ~12% CAGR
- 5x faster decision-making in BI-mature organizations vs. peers
The 2026 Drivers You Can't Ignore
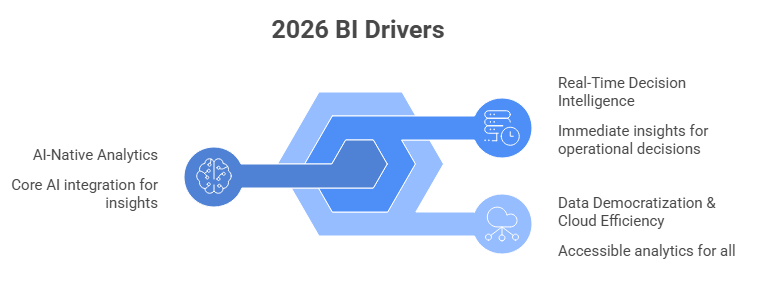
AI-Native Analytics
Generative AI is no longer a novelty layer on top of BI it’s embedded in the core. Natural language querying lets a marketing manager type “show me which campaigns drove the most qualified leads last quarter” and get an instant visual answer, no SQL required. AI also proactively surfaces anomalies, explains root causes, and recommends actions before users even formulate the question.
Real-Time Decision Intelligence
In e-commerce, a 60-second delay in detecting a checkout friction issue costs thousands of dollars. In manufacturing, a sensor anomaly spotted two minutes late can halt an entire production line. BI platforms now ingest streaming data from Kafka, Kinesis, and Pub/Sub making operational intelligence a reality for businesses of all sizes.
Data Democratization & Cloud Efficiency
Modern platforms empower finance, HR, operations, and marketing to build their own analyses within governed guardrails. Cloud-native BI on Snowflake, Databricks, and BigQuery makes enterprise-grade analytics accessible to mid-market companies with pay-as-you-go pricing and zero infrastructure overhead.
Real-world scenario: A regional retail chain with 80 stores deployed a cloud BI platform integrated with POS, inventory, and weather data. Within 90 days, they reduced out-of-stock incidents by 18% and improved seasonal markdown accuracy by 31% directly attributable to real-time replenishment dashboards replacing weekly Excel reports.
Core BI Strategies for Success
Build a Data-Driven Culture First
BI adoption fails when treated as a software rollout rather than a cultural transformation. Appoint a Chief Data Officer with board-level visibility, celebrate data wins publicly, and make data literacy training core to onboarding. Every successful BI implementation is championed by executive leadership that actively uses dashboards and ties performance to measurable KPIs.
Align KPIs to Business Outcomes
A dashboard showing 47 metrics is noise, not intelligence. A strong BI strategy starts with identifying the 5–8 KPIs that genuinely drive strategic outcomes per business unit. “If it doesn’t tie back to a decision someone needs to make, it doesn’t belong on the dashboard.”
Prioritize Data Governance and Quality
Bad data is worse than no data it creates false confidence. A mature governance framework defines ownership, quality standards, and access controls across every data asset. Automated tools in platforms like Collibra, Alation, and Microsoft Purview make this far less painful than even three years ago.
Design for Scalability
Your BI architecture should be modular and cloud-native capable of growing with your data volumes without costly re-platforming. Favor open standards (Apache Iceberg, dbt, Parquet) over proprietary lock-in.
Step-by-Step BI Implementation Guide
Implementing BI successfully is part technology, part change management, and part strategy. Here’s the proven framework that elite business intelligence implementation services practitioners use.
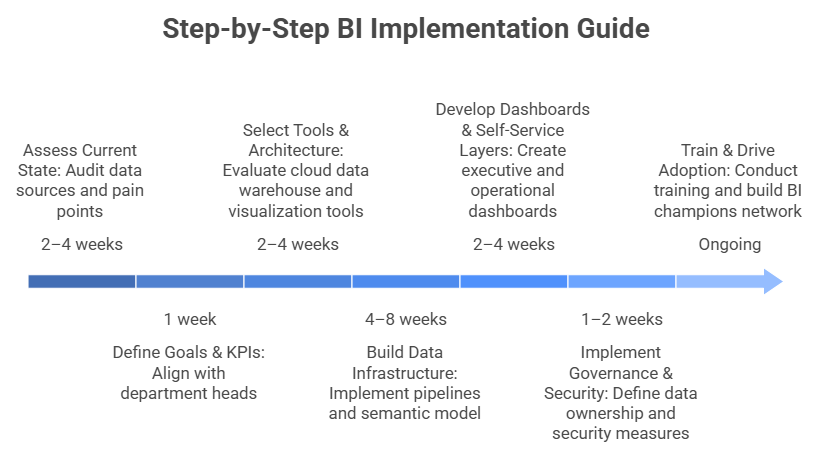
- Assess Current State: Audit existing data sources, tools, and pain points. Map where silos exist and what integrations are missing. This 2–4 week phase is the single biggest differentiator between successful and failed BI projects.
- Define Goals & KPIs: Align with department heads on 3–5 strategic outcomes for Year 1. Document them in a BI charter with executive sign-off. Avoid the “dashboard for everything” trap prioritize ruthlessly.
- Select Tools & Architecture: Evaluate your cloud data warehouse (Snowflake, BigQuery, Redshift), transformation layer (dbt, Fivetran), and visualization layer separately. Best-of-breed architectures often outperform monolithic suites.
- Build Data Infrastructure: Implement pipelines ingesting from ERPs, CRMs, marketing, and finance systems into a centralized cloud warehouse. Build your semantic model so “revenue” means the same thing in every report, for every user.
- Develop Dashboards & Self-Service Layers: Build executive dashboards first for immediate buy-in, then layer in operational dashboards per team. Design for end users minimal clicks to key insights, clear labels, and contextual tooltips.
- Implement Governance & Security: Define data ownership, access roles, and quality standards before go-live. Implement row-level security, PII masking, and audit logging. Compliance (GDPR, HIPAA, SOC 2) must be baked in not bolted on.
- Train & Drive Adoption: Run role-specific training, build a BI champions network in each department, and measure adoption via usage metrics. Adoption is an ongoing program, not a one-time event.
Common BI Challenges and How to Overcome Them
- Data silos: Build one central warehouse as the single source of truth. Use Fivetran or Airbyte to connect systems and standardize key definitions like “revenue” or “active users.”
- Low adoption: Involve end users in design from day one. Show quick wins within 30 days and assign a BI champion per department to keep engagement alive.
- High costs: Start small one department, five KPIs prove value, then scale. Cloud BI eliminates hardware costs; choose a business intelligence consulting partner with a fixed scope and clear delivery plan.
- Data quality issues: Run automated checks using dbt or Great Expectations. Assign data owners accountable for accuracy and maintain a visible “data health” dashboard.
- Security & compliance: Label data by sensitivity from the start, apply column-level security and masking, and work with a bi consulting company that understands your industry’s regulatory landscape.
- Talent gaps: Choose self-service business intelligence tools for non-technical users and engage business intelligence consulting services where knowledge transfer is a contractual deliverable not an afterthought.
Future Trends in Business Intelligence
- Agentic AI in Analytics: AI systems will proactively monitor data streams, detect patterns, draft reports, and route them to the right stakeholder without human prompting. Platforms like ThoughtSpot Sage, Microsoft Copilot in Fabric, and Databricks Genie are early previews.
- Augmented Analytics as Standard: By 2027, AI surfacing “what you should know” rather than waiting to be asked will be table-stakes. Natural language interfaces will replace SQL for 60%+ of business users.
- Embedded BI: Analytics is moving directly into the workflows where decisions happen inside CRMs, ERPs, and SaaS products eliminating the need to context-switch to a separate platform.
- Streaming Analytics at Scale: Sub-second insight latency is already operational reality in fintech, healthcare, logistics, and retail powered by Apache Flink, Kafka Streams, and ksqlDB integrated with cloud warehouses.
- The Semantic Layer & Data Mesh: Universal semantic layers (Cube, AtScale, dbt Semantic Layer) ensure metric consistency across every BI tool. Meanwhile, data mesh architectures let domain teams own and publish their own data products under federated governance enabling analytics at scale without a centralized bottleneck.
Final Thoughts: The Time to Act Is Now
Business Intelligence has moved from competitive advantage to competitive necessity. In 2026, the question is no longer “should we invest in BI?” it’s “how fast can we build the capabilities to outpace our competitors?” The organizations winning with BI started with a clear strategy before touching tools, invested in data culture alongside technology, and worked with experienced partners who compressed the learning curve.
Ready to Transform Your Business with Intelligence?
App Maisters is a specialist bi consulting company helping organizations design, build, and scale modern data analytics solutions. From strategy and tool selection to full-stack business intelligence implementation services and ongoing optimization, our bi consulting team has delivered measurable ROI for clients from fast-growing startups to Fortune 500 enterprises.
FAQs
What does a business intelligence consulting company actually do?
App Maisters helps organizations transform raw, scattered data into clear and actionable insights. This includes selecting the right business intelligence tools, building dashboards, data pipelines, and governance frameworks. App Maisters manages the full journey so your teams spend less time chasing numbers and more time making confident decisions.
How long does a BI implementation take?
For most mid-sized organizations, App Maisters delivers a fully functional BI foundation including data integration, warehouse setup, and dashboards within 8 to 16 weeks. App Maisters follows a phased approach so you start seeing value within the first 30 days. Larger enterprise rollouts may take longer depending on complexity and compliance requirements.
What is the difference between business intelligence and data analytics?
Business intelligence focuses on reporting what has already happened through dashboards, KPIs, and historical trends. Data analytics goes further predicting what will happen and prescribing what to do next. App Maisters delivers both through integrated data analytics solutions, giving your organization a complete picture from past performance to future opportunity.
Which business intelligence tools are best for small and mid-sized businesses?
The right tool depends on your tech stack, team maturity, and budget. App Maisters typically recommends Power BI for Microsoft-heavy environments and Metabase for startups needing fast self-service analytics. App Maisters conducts a structured tool evaluation for every client to ensure the right fit not a one-size-fits-all recommendation.
How much do business intelligence consulting services cost?
BI consulting costs vary based on scope, data sources, and level of customization required. App Maisters offers flexible engagement models from focused strategy projects to full-stack business intelligence implementation services so you only pay for what your business needs. App Maisters clients consistently report measurable ROI within the first 90 days of going live.
How do I know if my business is ready for a BI solution?
If your teams rely on outdated spreadsheets, conflicting reports, or gut feeling to make decisions you’re ready. App Maisters looks for common signals like data silos, no single source of truth, and slow manual reporting cycles. You don’t need a perfect data environment to start App Maisters is built to meet organizations exactly where they are.
What makes App Maisters different from other BI consulting firms?
Unlike generalist IT consultancies, App Maisters is a specialist bi consulting company focused exclusively on business intelligence and data analytics solutions. App Maisters combines a proven implementation framework with hands-on knowledge transfer so your internal team stays empowered long after the engagement ends. That focused expertise means faster implementation, better results, and no dependency on ongoing support to keep things running.